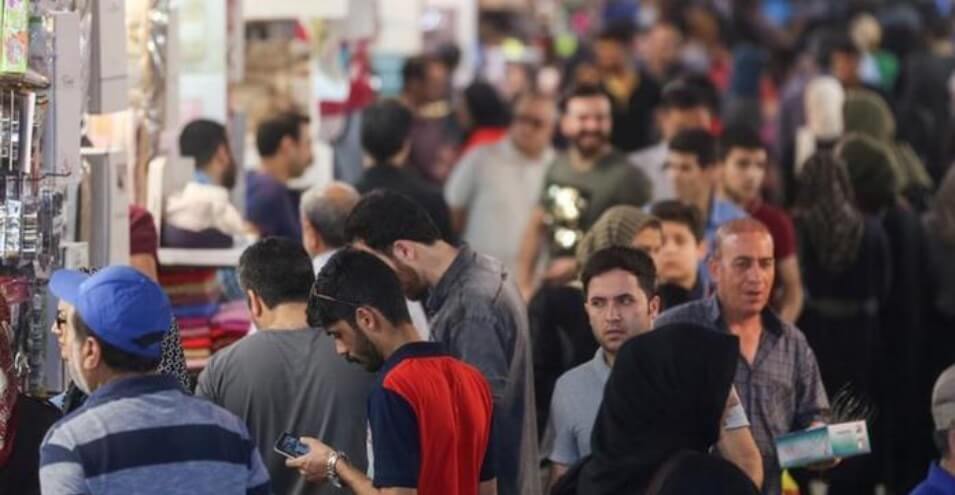
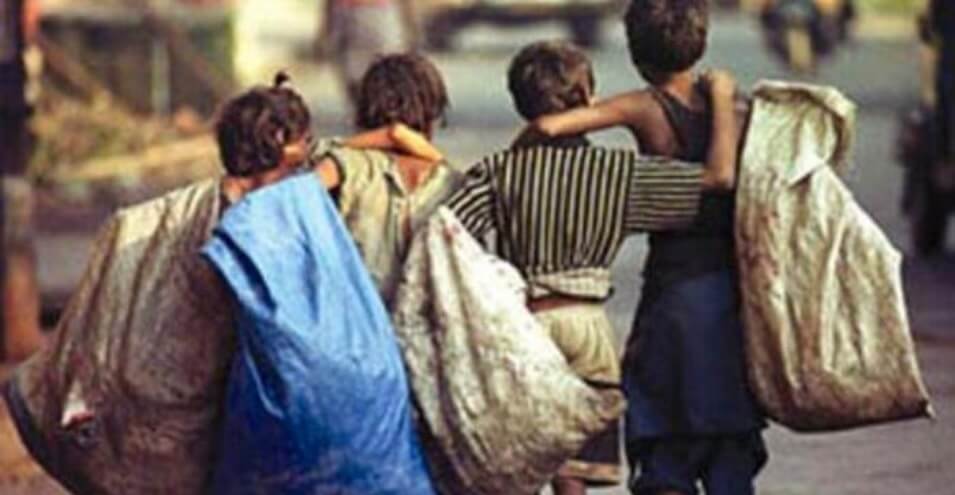
Tehran’s Poverty Line Nearly Doubled in Two Years
The Research Center of the Iranian Parliament has released a report on Iran’s economic situation. According to this report, the poverty line, inflation rate, unemployment, and Gini coefficient have all shown an upward trend over the past eight years.
The national average poverty line in Iran has increased from 500,000 tomans per month for a four-member family in 1390 (2011) to 2 million tomans in 1398 (2019). In Tehran, the poverty line has risen from 1 million tomans in 1390 (2011) to 4.5 million tomans.
In 1396 (2017), the national average poverty line was slightly less than 1.5 million tomans, and Tehran’s poverty line was 2.5 million tomans, meaning that within two years, Tehran’s poverty line nearly doubled.
This data was published in the latest report from the Parliamentary Research Center. According to the report, the national poverty rate increased from slightly above 15 percent in 1390 (2011) to 18.4 percent in 1397 (2018). This is the highest national poverty rate from 1390 to 1397.
Per Capita Income
The report also states that per capita income from 1390 to 1398 (2011-2019) declined by 34 percent, and the purchasing power of each Iranian decreased by approximately one-third compared to 1390 (2011).
While each Iranian’s per capita income was slightly above 7 million tomans in 1390 (2011), this income has dropped to 4.8 million tomans in 1398 (2019).
The trend of per capita income during these years has consistently been declining, except for 1396 (2017), when per capita income increased by approximately 1 million tomans compared to 1395 (2016).
According to the report, if 8 percent economic growth is achieved from 1399 (2020) onwards, six years will be needed to return to the income level of 1390 (2011).
Economic Growth
The Parliamentary Research Center reported in its report that Iran’s average economic growth rate from 1391 to 1398 (2012-2019) was close to zero. This rate has also fluctuated significantly in recent years, for example, declining from around negative 8 percent in 1391 (2012) to around 13 percent in 1395 (2016), and then falling back to around negative 7 percent in 1398 (2019).
The forecast for the economic growth rate for 1399 (2020) is around negative 6 percent, and for 1400 (2021) is around 3 percent.
Inflation Rate
The Parliamentary Research Center reported Iran’s long-term average inflation rate to be close to 20 percent. This is while the world’s average inflation rate in 2018 was 2.4 percent. After Venezuela, Zimbabwe, and Argentina, Iran has the highest inflation rate.
According to the report, the point-to-point inflation rate in 1398 (2019) was slightly above 50 percent. This is the highest inflation rate since 1373 (1994) to the present.
Point-to-point inflation for food and beverages in 1398 (2019) was 85.3 percent.
In calculating point-to-point inflation, the price index of goods is measured at the end of each month compared to the same month of the previous year. For example, the price index of Ordibehesht 1399 (the weighted average of household basket prices) is compared to the price index of the corresponding period of the previous year, which is the price index in Ordibehesht 1398.
Unemployment Rate
The Parliamentary Research Center reported the unemployment rate by province, gender, youth, and graduates.
On this basis, among provinces, Kermanshah has the highest unemployment rate at 18.7 percent. After that, Chaharmahal and Bakhtiari province ranks with 17.4 percent, and Khuzestan with 15.7 percent.
The unemployment rate in Tehran province is 12.2 percent.
In most provinces, the female unemployment rate is significantly higher than that of males and sometimes up to twice as high. Only in the provinces of North Khorasan, Zanjan, and Hamadan is the female unemployment rate slightly lower than that of males.
Gini Coefficient
According to the report of the Iranian Parliamentary Research Center, the Gini coefficient has increased from 37 percent in 1390 (2011) to 40.9 percent in 1397 (2018). The report states: “The upward trend of the Gini coefficient and the ratio of the richest ten percent to the poorest ten percent of the population from 1392 (2013) onwards indicates a significant increase in inequality and social gap as a result of negative economic growth and high inflation in the economy during these years.”
The Gini index or Gini coefficient is an economic indicator for calculating the distribution of wealth among people. A high value of this coefficient in a country is usually considered as an indicator of high class differences and income inequality in that country.
Source: DW